
In brief
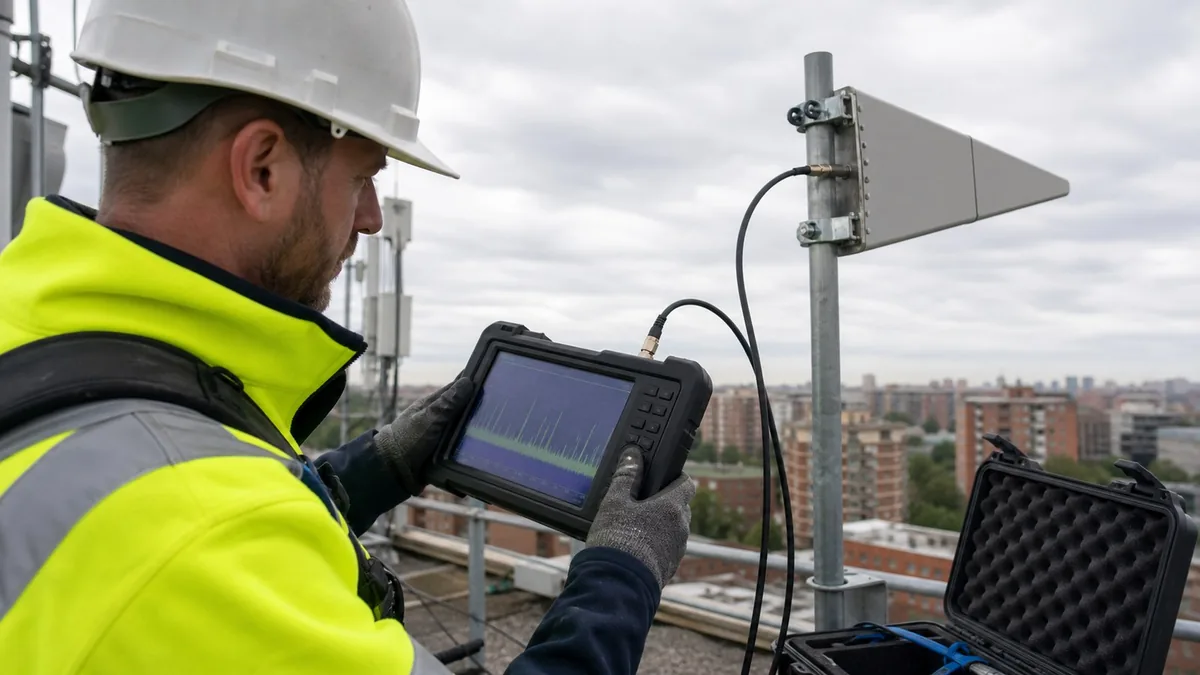
Choose a handheld spectrum analyzer from the signal and field workflow: required frequency coverage, weakest signal, shortest event, real-time span, input protection, portability, and exportable evidence. The best fit is the instrument that can capture the target event on site and return enough settings and raw data for another engineer to review it.
Key takeaways
- Define the target frequency, signal level, bandwidth, event duration, and signal behaviour before comparing analyzer specifications.
- Evaluate DANL and real-time bandwidth with the antenna, attenuation, preamp, RBW, site noise floor, and shortest event rather than as isolated headline values.
- Accept the field kit only when it records location, operating state, analyzer settings, accessories, screenshots, and exportable trace or IQ data.
A handheld spectrum analyzer is valuable because it moves the measurement plane to the place where the fault occurs. That advantage can be lost if the field team returns with only a phone photograph of a peak. Good troubleshooting preserves the signal, location, time, antenna path, analyzer state, system operating mode, and alternative explanations well enough that another engineer can review the conclusion.
Selection therefore begins with a field hypothesis. Write what is failing, when it fails, which service or channel is affected, the suspected band, whether the event is continuous or intermittent, and what observation would support or falsify the suspected source. “Find interference” is not yet a measurement plan.
Define the signal and the evidence threshold
For each target, list centre/range frequency, expected bandwidth, minimum level at the analyzer input, strongest nearby signal, shortest event, repetition pattern, modulation or pulse character, and required evidence. Separate discovery from quantification. Discovery may use max hold, spectrograms, broad spans, and multiple antennas. Quantification needs a defined measurement plane, calibrated path, stable setup, uncertainty, and appropriate method.
Specify whether the deliverable is:
- source localisation for maintenance;
- before/after comparison after mitigation;
- spectrum occupancy over a defined place and time;
- field-strength measurement;
- waveform or IQ capture for laboratory analysis;
- screening evidence for a regulator, operator, or customer; or
- EMC engineering debug that will later be repeated under a formal method.
ITU-R SM.1880 shows that occupancy measurement depends on site, time parameters, sampling, accuracy, statistical confidence, and presentation. A single screenshot cannot establish “the channel is occupied 20% of the time.” Likewise, an intermittent peak observed once is a lead, not yet a source attribution.
Design the complete RF path
The analyzer input sees the output of an antenna or probe, cable, adapters, filters, attenuators, preamplifiers, and any coupler—not the field directly. For an electric-field measurement expressed in logarithmic units, a common structure is:
E(dBµV/m) = V_receiver(dBµV) + AF(dB/m) + L_cable(dB) + L_other(dB) - G_preamp(dB)
AF is the antenna factor at the measurement frequency. Every correction must be frequency-specific, traceable to the selected accessory, and applied only once. If the analyzer reports dBm into 50 ohms, convert using the correct impedance relation before mixing units; do not add dBm directly to an antenna factor expressed for dBµV.
This equation does not remove environmental uncertainty. Antenna orientation, height, polarisation, near-field coupling, multipath, reflections, source variability, cable movement, and position all affect the result. Recommendation ITU-R SM.378 provides official field-strength measurement context and recognises limitations from receiver noise, atmospheric noise, external interference, and other factors. For a defensible result, record these contributors and the attainable uncertainty rather than quoting display resolution.
Near-field probes are excellent for localisation but generally do not create a calibrated far-field strength result by default. A directional antenna can help form a bearing, but reflections can produce a stronger apparent direction than the direct path. Use multiple positions, orientations, heights, and—where appropriate—attenuation steps before assigning a source.
Protect dynamic range before chasing sensitivity
Displayed average noise level (DANL) is one part of sensitivity, but field detection is governed by the complete path and environment. Narrower resolution bandwidth reduces displayed noise in many analyzer modes but slows sweeps and can miss or distort short events if the capture method is unsuitable. Preamplification can reveal weak signals yet reduce available headroom in the presence of strong transmitters.
ITU-R SM.575 specifically warns that strong nearby transmitters can cause receiver desensitisation, blocking, and false emissions at monitoring stations. The same mechanisms matter to a handheld investigation. Before enabling a preamp, identify nearby transmitters and expected input level. Carry rated attenuators, band-reject or band-pass filters, a DC block where appropriate, and known-good cables. Never connect directly to a transmitter path unless the coupled level, isolation, power, and analyzer input limits have been engineered.
Use the attenuation test as a field diagnostic. Add a known amount of attenuation and observe whether a suspect signal changes consistently after corrections. If unrelated products move unpredictably, disappear, or appear, front-end overload or intermodulation may be involved. An internally generated product can point to a real strong-signal environment, but its displayed frequency is not necessarily the emitter’s frequency.
Match time capture to the event
A swept trace, zero-span trace, spectrogram, real-time display, triggered capture, and stored IQ record answer different questions. Choose among them based on event duration, repetition, bandwidth, and required post-analysis.
For a stable continuous carrier, a swept analyzer may be sufficient. For frequency hopping, short bursts, state-dependent interference, or radar-like pulses, real-time bandwidth and probability of intercept under the stated conditions become important. A quoted real-time span does not guarantee capture if the event is outside that span, below the trigger/noise threshold, too short for the specified probability condition, or obscured by a stronger signal.
Create a time-correlation plan. Record local time source, timezone, clock accuracy, DUT or network event logs, and relevant operating transitions. If GPS or another reference is used, record lock state rather than assuming every file has valid position and time. A spectrum event that aligns repeatedly with a machine cycle, transmitter key-up, power-converter state, or alarm is more persuasive than a visually similar peak from a different time.
Use a staged localisation method
- Reproduce and timestamp: confirm the affected service and capture at least two occurrences with operating-state notes.
- Establish a baseline: observe the band away from the suspected source or with controllable equipment off where safe and authorised.
- Protect the input: set attenuation/preselection for the strongest plausible signal before optimising weak-signal sensitivity.
- Survey broadly: use a suitable antenna and spectrogram/max-hold view to identify frequency and time patterns.
- Narrow the hypothesis: reduce span, choose appropriate bandwidth/detector, and correlate with system state.
- Localise: compare positions, antenna orientation, polarisation, attenuation, and distance; account for reflections.
- Mitigate one variable: filter, separate, bond, reroute, repair, or switch the suspected source under authorised conditions.
- Repeat the controlled observation: retain before/after data with identical settings where practicable.
The Australian Government notes that interference can originate from other RF signals or electrical devices, and warns that opening protective covers can create electrocution risk. Field RF investigation does not authorise access to live electrical equipment, rooftops, towers, transmitter enclosures, or licensed services. Use qualified personnel, site permits, fall protection, RF-exposure controls, and electrical safety procedures as applicable.
ACMA provides an official investigation request route. A field report can support that process, but it should not claim regulator authority, identify a party publicly without adequate evidence, or transmit test signals without spectrum and site authorisation.
Illustrative worked example — not a real interference case
Assume a fictional rooftop measurement at 915 MHz. The receiver indicates 58 dBµV. The controlled antenna table gives an antenna factor of 24 dB/m, cable loss is 2 dB, and an external preamplifier provides 10 dB gain at that frequency. The calculated field level at the declared point is 58 + 24 + 2 - 10 = 74 dBµV/m before the full uncertainty treatment.
Suppose the standard uncertainties attributed for this illustration to receiver/correction, antenna factor, and site repeatability are 0.5 dB, 1.0 dB, and 2.0 dB and are treated as independent for this simplified model. A root-sum-of-squares screening value is about 2.3 dB. This is not a complete or universally valid field uncertainty; mismatch, position, polarisation, reflections, source variation, and correlation may require additional treatment. NIST TN 1297 supports building the model from actual contributors rather than copying these values.
The team then rotates a directional antenna, changes location, repeats the measurement with 10 dB more attenuation, and correlates events with equipment logs. Only if the pattern repeats and alternative causes are addressed does the source hypothesis strengthen. None of the figures is a regulatory limit, XGY detection guarantee, or customer result.
Field-kit acceptance matrix
| Question | Evidence required | Reject or rework when |
|---|---|---|
| Can it cover the target? | Frequency/bandwidth, expected input level, shortest event, real-time span, and mode selection | Selection uses upper frequency alone or the event cannot fit the capture mode |
| Can it survive the site? | Strongest nearby signal, input limit review, attenuation/filter plan, accessories, and safe connection procedure | A preamp is the only sensitivity plan near high-power transmitters |
| Can it distinguish real from internally generated signals? | Attenuation test, filter comparison, multiple spans/positions, and overload status | Peaks change inconsistently or receiver compression is not investigated |
| Can it support localisation? | Calibrated/known antenna options, orientation record, map/coordinates, photos/sketch, and repeat bearings | One maximum reading is treated as a unique direction in a reflective environment |
| Is the accessory kit complete? | Antenna or near-field probe, rated attenuator/filter, coupler or adapter, known cable, battery/charger, tripod, and safe carry method as applicable | The analyzer covers the band but the site kit cannot couple to the signal safely or repeatably |
| Can the result be reviewed? | Raw trace or IQ, screenshot, settings, corrections, time/location, accessory IDs, and operator notes | The only retained evidence is a screen photograph |
| Is the form factor appropriate? | Decision record for handheld, USB, benchtop, networked, or rack operation | A handheld is selected for a task that actually requires unattended, remote, synchronized, or production operation |
| Is the conclusion appropriately bounded? | Hypothesis, alternatives, repeat observations, mitigation result, uncertainty, and escalation route | Debug evidence is labelled a regulatory finding or guaranteed source attribution |
Product boundary
Within current approved XGY product content, YSA-P400 is listed with 9 kHz–40 GHz coverage, a stated DANL down to -161 dBm/Hz at 1 GHz under its published conditions, 100 MHz real-time bandwidth, and a 1.5 kg handheld form factor. Those figures are selection boundaries, not a promise to detect every signal. Antenna factor/gain, cable loss, input protection, attenuation, preamp, RBW, real-time span, trigger, event duration, site noise, propagation, and interference determine the field outcome.
The broad frequency range can reduce platform changes across low-frequency clues, sub-6 GHz systems, and microwave investigations. The 100 MHz real-time bandwidth can assist with intermittent signals that fit within the configured span and capture conditions. The handheld form can improve access. None of those features converts an engineering field observation into 5G conformance, EMC compliance, spectrum-monitoring accreditation, or regulator evidence without the relevant method and process.
Common failure modes
- Chasing a low DANL while a nearby transmitter compresses the analyzer.
- Applying antenna gain where an antenna factor is required, or mixing dBm and dBµV.
- Treating a near-field probe reading as calibrated far-field strength.
- Using max hold to claim occupancy without defined observation and sampling.
- Assigning a source from one bearing in a multipath environment.
- Capturing the event but omitting system state, clock basis, accessory IDs, or raw data.
- Performing unauthorised transmissions or unsafe access in the name of troubleshooting.
Source-to-claim map
| Claim area | Primary-source basis | Boundary retained |
|---|---|---|
| Field measurements need controlled equipment, method, and accuracy context | ITU-R SM.378 | The article gives no universal field-strength accuracy |
| Strong transmitters can desensitise/block receivers and create false indications | ITU-R SM.575 | No specific YSA immunity level is inferred |
| Occupancy requires site, time, sampling, and statistical definition | ITU-R SM.1880 | A field screenshot is not represented as occupancy evidence |
| Australian interference investigation has safety and regulator boundaries | ACMA and Australian Government sources | XGY field work is not presented as an ACMA determination |
| Interference practice guidance is not automatically a legal requirement | CISA guidebook | Applicable rules and permissions remain case-specific |
| Derived measurements require an uncertainty model | NIST TN 1297 | The worked calculation is illustrative only |
Product fit
Where XGY Tek fits
The listed YSA-P400 series can be reviewed against the field frequency range, signal behaviour, event duration, real-time span, input protection, accessory, battery, and data-export requirements described here. Suitability for detecting a particular signal still depends on the complete antenna and measurement path, analyzer settings, and site noise conditions.
Spectrum Analyzers
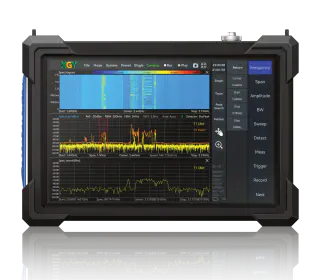
YSA-P400 Spectrum Analyzer
XGY YSA-P400 is a handheld portable precision real-time spectrum analyzer for 9 kHz to 40 GHz RF analysis. It delivers -161 dBm/Hz DANL, 100 MHz analysis bandwidth, and a 1.5 kg portable form factor for 5G network maintenance, radar testing, interference hunting, and EMC pre-compliance.
View product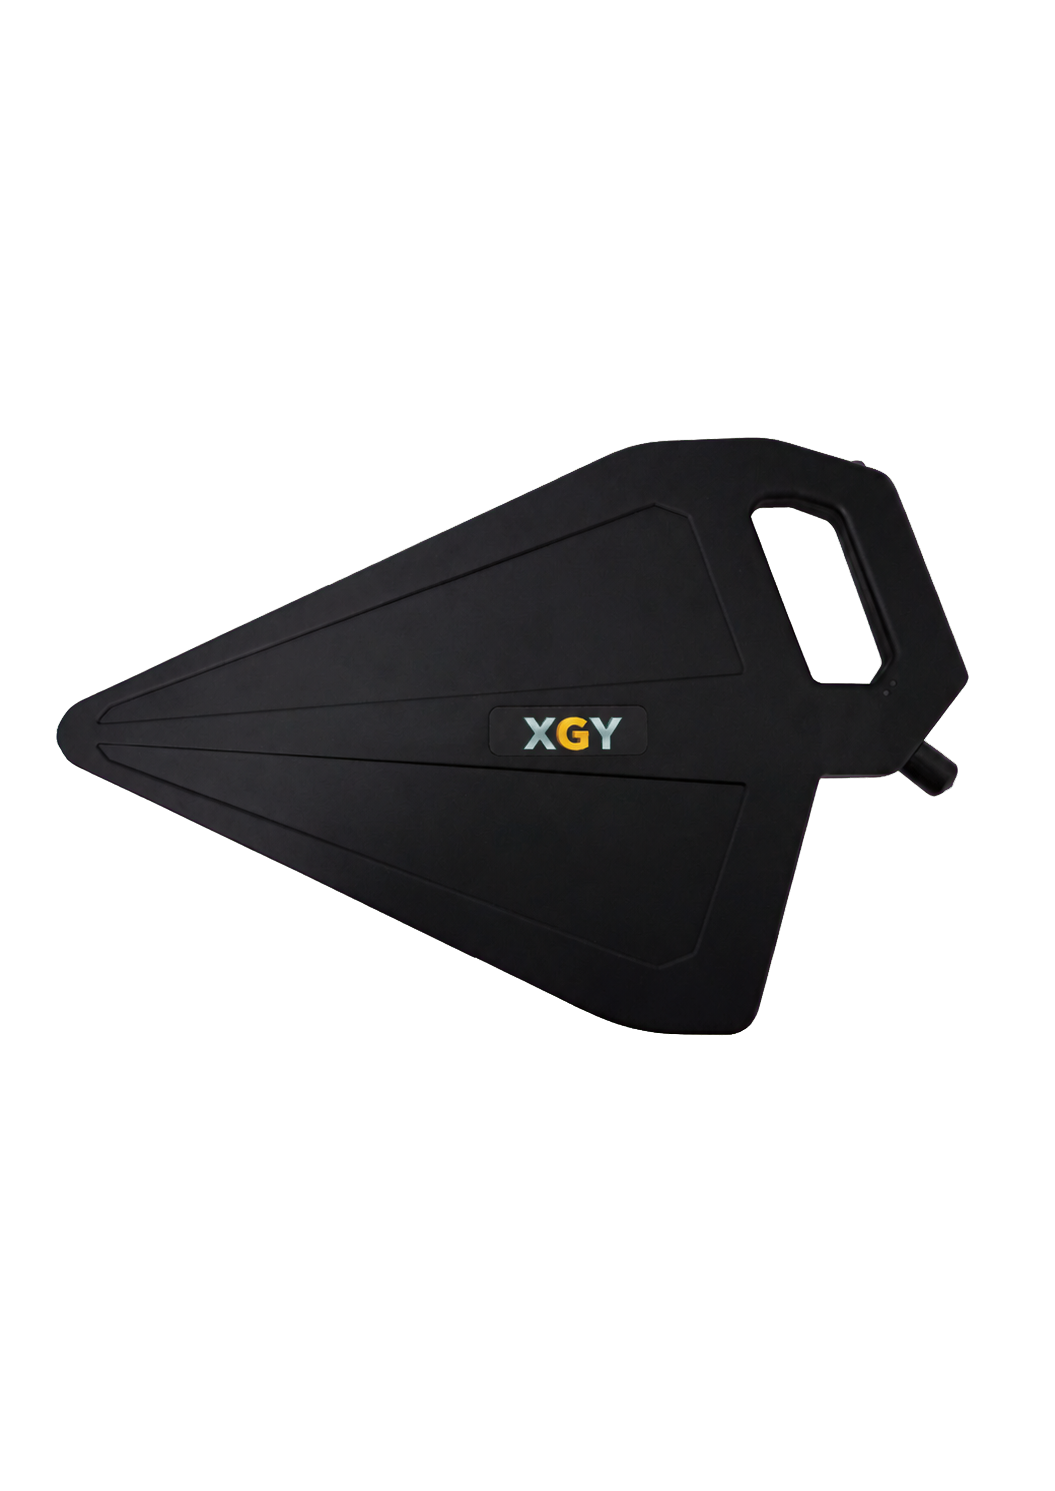
RF Accessories
XDA-1000 / XDA-2000 Active Directional Antennas
XGY XDA-1000 and XDA-2000 are active directional antenna accessories for YSA-P400 spectrum analyzers. They cover 500 MHz to 10 GHz or 20 GHz with a switchable broadband amplifier, real-time pitch, roll, and heading sensing, and 50 MHz-spaced antenna-factor calibration data.
View productFAQ
Frequently asked questions
What is the first question in an interference-hunting plan?
Define the signal boundary before the analyzer model: target band, expected level, bandwidth, event duration, modulation or pulse behaviour, antenna or probe method, site conditions, and whether the task must locate a source or only document that interference exists.
How should a buyer interpret DANL for field troubleshooting?
DANL is a useful sensitivity indicator, but the field result depends on antenna gain, cable loss, preamp state, attenuation, RBW, site noise floor, and the distance to the source. A weak-signal search should define the expected signal level at the analyzer input, not only compare analyzer datasheet numbers.
When does real-time bandwidth matter more than sweep speed?
Real-time bandwidth matters when the event is intermittent, short, hopped, or difficult to trigger. If the signal is continuous and stable, a swept analyzer can be enough. If the problem appears for microseconds or only when equipment changes state, probability of intercept and real-time span become selection criteria.
What should a field RF report include?
A field report should include site name, measurement point, antenna or probe, frequency span, RBW/VBW, detector or trace mode, attenuation/preamp state, screenshots, exported traces, peak table, time or GPS notes if relevant, and operator comments. Those fields make the result useful after the team leaves the site.
When is a handheld analyzer the wrong tool?
A handheld analyzer is the wrong primary tool when the measurement must run unattended in a rack, synchronize tightly with other instruments, or feed a production database. In that case, a networked, PXIe, or USB instrument may fit the automation workflow better, while the handheld remains useful for field debug.
Keep exploring
Related technical resources
Related articles
Technical Article
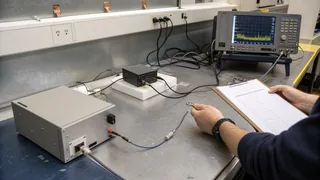
EMC Pre-Compliance Setup: LISN, Spectrum Analyzer, and Reporting
How engineering teams should scope an EMC pre-compliance bench with a LISN, spectrum analyzer, cables, limits, and repeatable reporting.
Read article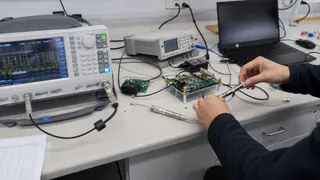
Technical Article
RF Signal Generator Checklist for Receiver Test
How to select an RF signal generator for receiver sensitivity, radar, 5G, satellite, and automated RF test workflows.
Read article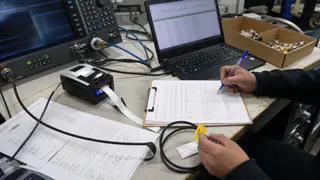
Procurement Checklist
RF Test Equipment RFQ Checklist for Global Buyers
A practical RFQ checklist for RF test equipment buyers covering frequency range, bandwidth, power, calibration, fixtures, acceptance evidence, and export screening.
Read article